If you haven’t read my previous article entitled Education – Failing Critical Tests, I must warn you that this is a continuation of that article. You might be well advised to read that one first.
I want to tell you how Canada performed on PISA testing 2025, but first I need to tell you about how the PISA testing is conducted. I worked through a press release and a report on Canada from the OECD, and a long report from the Council of Ministers of Education in Canada (CMEC). I now know way more about that testing process than I ever wanted to know and I’m struggling not to get into full-scale verbal diarrhea trying to tell you all I’ve learned.
I’m going to try not to bury you with numbers and scores. (Well, a few numbers are inevitable). I’m going to try to identify comparative bases for things and show how Canada compares with other nations, and internally in Canada how the provinces compare to each other. In most cases, if you want actual numbers, you’ll have to look ‘em up.
The PISA test reporting is, in some cases, linked to a national sub-set like the four large economic units in China. When I tell you our placement in the world, it’s a placement amongst nations or large national sub-units.
The PISA tests are administered every three years. In each test program, students are evaluated on reading, math, and science, but one area is a focus area each time. In 2025, the focus was science. The tests are given to an expanding group of countries each time, so the comparison base keeps expanding. The testing base was 70ish countries in 2015, and 91 in 2025.
In both the CMEC report and the OECD reports, comparisons are often made to the OECD countries alone, and not to all of the nations for which results were obtained. I’m not sure why that is, but I expect that they believe that there is a better basis for comparison there because those OECD countries are similar in a lot of ways and so the comparisons are probably more statistically convincing.
For Canada, there is good news and there is bad news. We’ll start with the good news. Canada was 8th in the world in science, 11th in reading and 10th in math out of 91 tested nations. Consistent with those results, Canadians have more students who are rated as high achievers, and fewer students who failed to make the “baseline adequate” level than the OECD average. In science, for example, Canadian students are approximately 1.5 – 2 years ahead of the OECD average. (We are, however, 3-4 years behind the high performing Chinese sub-national blocs and Singapore).
And now….the bad news. While a smaller fraction of Canadian students fail to achieve the baseline level than in other OECD countries, nevertheless, about one in six falls below the standard. That Level 2 standard is described as “the baseline level of proficiency required for students to participate meaningfully in modern society.” Maybe a one in six failure rate means that our system is failing. Or maybe it just means that there will always be people on the far left side of the bell curve for intelligence (or at least book-learnin’ intelligence) distribution and they will always need help through their lives to “participate meaningfully in modern society”.
Canada’s 2025 results in science, reading and math were 510, 490, and 485, down from 2015 results by 18, 37 and 31 points respectively. In all three subjects, PISA 2025 results are the lowest ever observed in Canada. Objectively, Canada’s 15 year olds, the group assessed in PISA testing, are 1.5 to 2 years behind where that demographic was ten years ago.
The data tells us that the world wide decline in scores is replicated in Canada and that it is a long-term trend.
– In only one year (2015) since 2006 has Canada’s science score bettered the previous score.
– Math in 2009 was the same score as in 2006. In all other years, the score has declined.
– In reading, scores in 2015 were higher than in 2012, but that was then followed by a precipitous decline.
The OECD sliced and diced the 2025 data in a bunch of ways. That analysis produces some note-worthy results. If you’re looking to reverse that long-term trend, then understanding the underlying correlations is important.
- The instances of “hasty reading” – in which students read quickly but inaccurately – nearly doubled between 2018 and 2025.
- The students fill out a questionnaire which established a student profile. One of the things they do with the profile his map the students into a “Socio-economic index” which pigeon-holes what kind of background produced this student. The socio-economic index incorporates things such as family income, parents’ education level, parents’ career achievement etc. So it’s not all about income. Canadian students rank high on the world’s scale of “socio-economically advantaged” students, which helps explain why Canadian students do very well.
- Internal to Canada, the top quartile of socio-advantaged students out-performed bottom quartile students by 59 points in science. On average in the OECD, that gap is 85 points. So that tells us two things. First is that home environment matters a lot. Second is that Canadian schools are doing a better job of helping out students from “difficult backgrounds” than schools in many other countries are.
- The gap between top quartile socio-economic environment kids and bottom quartile advantaged kids has been declining, which sounds good. Unfortunately performance since 2015 has declined to a larger extent among advantaged than among disadvantaged students. So the gap is closing, not because we’re doing a better job with disadvantaged kids, but because the kids from the best homes are coming back to the pack.
- Belief in the process is important. Students who believe that they can get better through work and effort actually do get better. Does that surprise anyone?
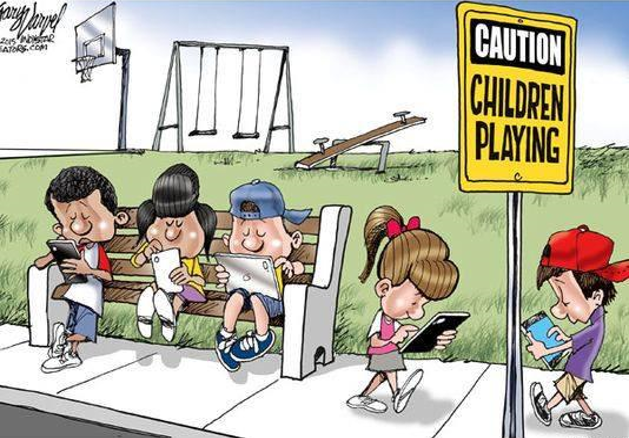
- Canadian students spend about 2/3 as much time on digital devices for leisure activity at school as they do for learning activities. Both the total time on devices at 2.8 hours per day and the learning/leisure ratio are consistent with the OECD average. One in three Canadian students is seen to be distracted by the use of digital devices.
- Canada lags behind the OECD average in the banning of cell phones in school.
- Chatbot use is increasing but Canada trails OECD significantly. That may be a good thing. The OECD report says “moderate use of digital devices for learning is associated with stronger science performance, while excessive use and digital distraction are associated with weaker outcomes.”
- The small fraction of students who reported having been the victims of cyber-bullying scored far below their peers. Seriously below. Cyber-bullying is a dangerous thing.
- Classroom discipline is a major problem. A third of students report noise and disorder in the classroom and suggest that classmates are not listening to the teacher. That finding is consistent across the whole of the OECD, not just Canada.
- Statistics show that absenteeism in Canadian schools is on the rise and exceeds the OECD average.
- Parents are statistically less likely to ask their kids how they’re doing at school or to offer help with school problems than they were even as recently as 2022.
- The prevalence of perceived teaching staff shortages in Canada did not change significantly compared to 2022.
After the OECD were done analyzing the data, the Council of Ministers of Education, Canada (CMEC) took their own crack at it. CMEC reported on some of the things that OECD did, but they added some twists that were of particular interest in Canada, and of course they broke the numbers down internally so that provinces could compare themselves to the rest of the country. So here’s what CMEC told us about the PISA scoring:
– Quebec, Ontario, BC, and Alberta drive the Canadian average in all subject areas and are above the OECD average. Sask, NS and Manitoba form a second group below the big four. That group is above the OECD avg but marginally below the Canadian average. PEI, NL and NB are grouped approximately at the OECD average. Here’s what else the CMEC found:
– There is little difference between English language and French language schools in achieving basic competencies. There is a slight advantage in English language schools in turning out high-level achievers.
– Minority language schools (French schools in Ontario, English schools in Quebec for example) show statistically poorer results than their majority language counterparts. It should be noted, however, that while English language schools in Quebec were below French language schools in that province, they nevertheless achieved results better than all provinces except Ontario and Alberta.
– Language in the home is a major contributor to education success or lack thereof. About 22% of Canadian students reported that the language of the home was “other” – that is, neither English nor French. Those students trail the students who speak one of the official languages at home by approximately a year of learning.
I was astounded to learn that on PEI, 18% of students reported speaking another language at home. Furthermore, the Acadian community on PEI has virtually disappeared – only 1% of students reported that they speak French at home. Meanwhile Alberta, despite their recent referendum which attempted to inflame anti-immigrant sentiment, has about the same fraction (24%) of “other” language students as Ontario, Manitoba and BC, and those four populous provinces pretty much establish what the Canadian average is.
– Immigrant status: People were pigeon-holed into three categories. Non-immigrant students have at least one parent born in Canada. Second generation immigrants were born in this country, but their parents were both born in a different country. First generation immigrant students are those where the parents and the student were all born outside Canada.
First generation immigrants are at the bottom of the heap. Non-immigrant students are next. And second generation immigrants performed best. What that tells us is that immigrants in Canada are hungry – they’re motivated to succeed. I have written before that I strongly support a pretty open and welcoming immigration policy, and this data is one of the best reasons I’ve ever come across to support that position. The future of the country lies in the hands of these 15 year old students, and the children of immigrant families are likely to contribute significantly to national prosperity.
– With only minor exceptions, there is very little gender gap in PISA test scores either here or in the OECD as a whole.
– There are three connected pieces of trend information that I think are revealing and disturbing. First, OECD countries (richer and better developed) showed greater decline in scores than non-OECD countries did. Second, Canada’s scores are declining faster than the OECD average. PEI, for example has drawn closer to the OECD score with every test, and in 2025 for the first time ever slipped below the OECD average score. Third, the OECD report says, “Socio-economic disparities narrowed across OECD countries between 2022 and 2025, driven by declining performance among advantaged students rather than gains among disadvantaged students.”
What do I think we can infer from all that data? First, let’s connect i) the data about rich countries and kids sliding faster than poor countries and kids ii) the data about the prevalence of “hasty reading” iii) the data about Canada trailing other countries in banning cell phones in class iv) the data about the potential over-use of chatbots as research sources and v) the negative impact on kids who have been cyber-bullied.
Those issues all point at electronic devices. I think there is an urgent need for Canada’s school systems to do some deep and searching analyses about how best to integrate digital devices, AI, personal cell phones and the like into the classroom. I think it’s imperative that kids learn how to use these devices to their advantage because that’s going to be part of the world for which education is supposed to be preparing them. But it’s even more imperative that kids are taught to think for themselves and not leave all the thinking to their devices.
Second, I think that the correlations regarding i) disorder and distraction in the classroom,ii) the lack of classroom discipline, iii) the rise in absenteeism, and iv) the apparent disengagement of parents from their kids school activities should cause parents to take a long look in the mirror.
Discipline and order in the classroom start in the home. The data which tells us that students who believe they can improve their results through work and study, coupled with the excellent performance of second generation immigrant kids reinforces the need for parents to set expectations and offer assistance and guidance.
None of the data in the OECD reports addressed the teaching methods issues that I brought out last time, so let me drop that in as a learning from the 50000 ft level view we did the last time. I do think that there is a body of data that tells us that more testing and less social advancement are necessary. In the age of AI, I believe the testing becomes more and more important. AI can write a wonderful essay or solve a difficult math homework question, but it can’t pull off an A in a pop quiz. Testing, with both successes and failures (especially failures), needs to be part of daily learning.
I promised to address some questions about how and where we’re spending pour education dollars, but this article is already long enough and long over-due. So, I’m going to stop there for now and delve into education spending in a follow-up article.